As a 23 year old Geology and Physical Geography (Bsc Hons) student at the University of Edinburgh, I’ve taken my first steps into Earth observation with the help of Earth Blox Education.
Earth Blox is a new web tool recently supported by the UK Space Agency and ESA and now available for institutions to use in teaching.
With over 700 meteorological and Earth observation satellites in orbit as of 2021, we have now greatly increased our capacity to measure the Earth. Having recognised the importance of satellites to inform our understanding of the planet, I took Professor Iain Woodhouse’s class in Remote Sensing and Global Climate Change, and through this course I gained a deeper understanding of the value of remote sensing.
This is where I discovered Earth Blox.
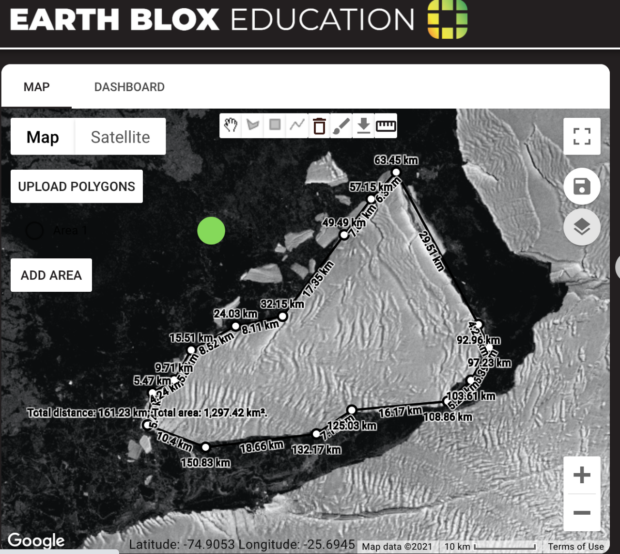
Working remotely through the Covid-19 pandemic, my dissertation took the shape of an Earth observation mission using satellite data, rather than fieldwork data. I wanted to explore the role that carbon in coastal systems (so-called “blue carbon”), has on the climate.
The ocean captures around 31% of our carbon emissions and stores much more carbon than any other natural system. It is being disproportionately affected by climate change, with increasing acidification threatening its delicate balance.
Within this system, coastal habitats are known to capture carbon more efficiently than terrestrial forests for the same area, and they act as much longer term carbon sinks. But they are disappearing fast: approximately 67% of global mangrove, 35% of tidal marsh and 29% of seagrass meadow has been lost.
The degradation of these habitats not only results in the release of massive amounts of CO2 but also in the loss of their role as storm barriers and high biodiversity areas. Excited to explore these habitats remotely, I was faced with another problem: I didn’t know how to write computer code.
Being proficient in Python or JavaScript (two of the most commonly used computer languages) seemed necessary to effectively analyse the data provided by these Earth observation satellite missions. On top of this, I struggled to make sense of the mountain of open access satellite data in order to find the best datasets for my study.
The power of Earth Blox
This is where Earth Blox provided a solution to my problem. Prof Woodhouse’s class had introduced us to this new tool, so that we could engage with global satellite data, but without having to download any data or install any software on my home computer.
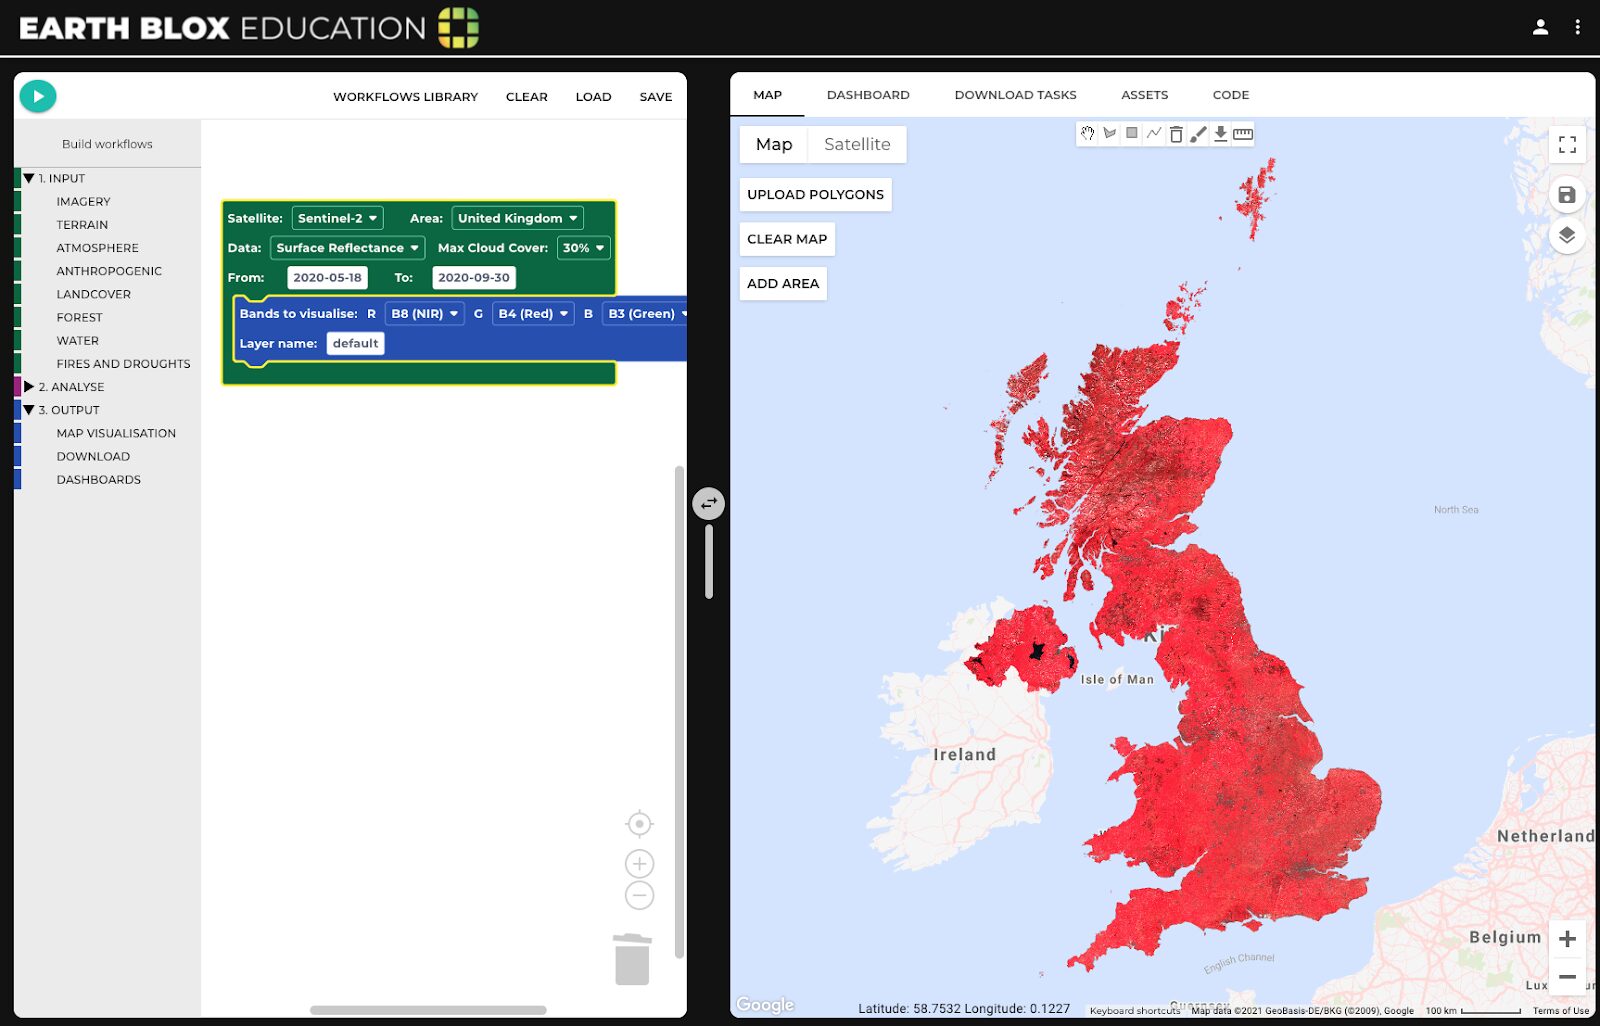
Most importantly, for me, Earth Blox gave me a way to explore satellite data without needing to code. It works by using distinct input, analysis and output blocks that can be combined (with a satisfying ‘click’ sound) to produce workflows that when “run”, produce map overlays and visualisations using a wide range of different satellite datasets and other map information.
For example, even though I can’t code, I could quickly create a “false colour” image (which shows vegetation as red) of the UK using up-to-date Landsat 8 or Sentinel 2 data simply by dragging two blocks together and selecting a time, area and band selection.
The beauty of Earth Blox is that it gave me the freedom to focus on what remote sensing could do without the initial trouble of learning to code. The thought of having to learn coding had been a daunting idea that had put me off using satellite imagery for my research.
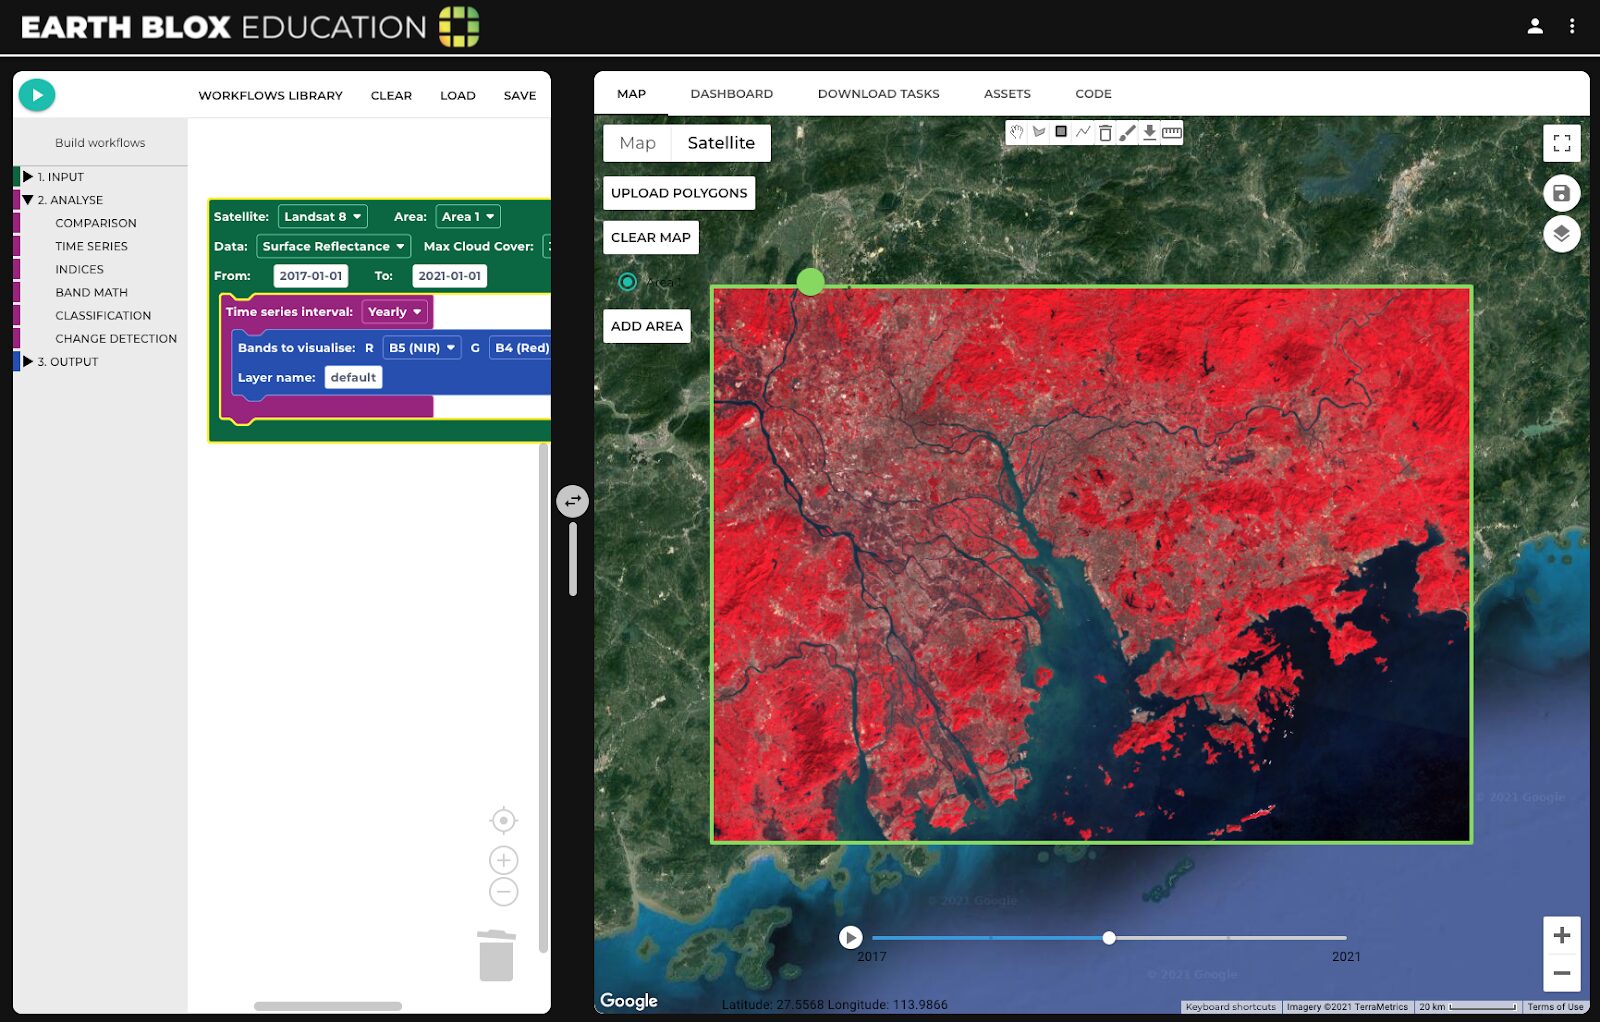
In my studies I used Earth Blox to have a first look at the changes apparent in the areas I was exploring: with ease, I could go from investigating the Greater Bay Area of Hong Kong, to the Ebro Delta in Spain. It was as simple as 1-2-3:
1) Drag over an Imagery Input block,
2) add in the NDVI Index Analysis block,
3) finish with an Other data visualisation block, and click “run”. This allowed me to compare the changes in vegetation density over time in Landsat 8 and Sentinel 2 data to estimate the decrease in natural land use as urban coastal areas expand. From there I created a time series of images to identify any changes over a four year period.
Eventually, I began to wonder how else this vast amount of data could be used and what other products have been created using the raw satellite data. Earth Blox became my stepping stone to Google Earth Engine -- it had given me the confidence to begin the process of learning how to code. I was able to produce my own figures exploring land surface temperature, NDVI and land use changes for my dissertation through this.
Earth Blox had been the tool I needed to understand the possibilities of remote sensing techniques, before embarking on a path to dig deeper and begin to learn to code.
Sign up to the FREE 'Observing Earth From Space' course today The course will use Earth Blox for Education to guide and teach satellite data analysis, without the need for code.
Leave a comment